“Data-driven recruiting.” Has a nice, cutting-edge, 21st-century sound, doesn’t it?
The question is, just what is data-driven recruiting and how can you go about getting some for your company?
- Every move we make online is tracked and the data is stored for companies like Google to use for everything from making our searches better to more accurately targeting advertising across their Ads network.
- Increasingly, companies are harnessing the power of all this data to improve business processes, making everything from bringing in more customers to making better hiring decisions ripe for a data-centric approach.
- There are many, many options for collecting, analyzing, and reporting on data. The trick is to figure out where to start and how to dive in without getting distracted by the often overwhelming number of options and the sheer quantity of data available.
Today we’re looking into but one of these options—Google Analytics, and how you as a recruiter can be using this incredibly powerful tool to power your searches and help find the quality candidates you need.
Before Data Analytics: Set Goals
Before you ask, yes, we know, Google Analytics is big. Like mind-bogglingly massive. Of all the data collection and analysis options out there, why on earth are we suggesting you start with one with so much potential to be overwhelming? Easy, because it’s also super easy to start small. But before we even get into it, you need to have your goals laid out. By going into a data project with clearly defined goals, KPIs, and metrics pre-selected, you’re far more likely to be able to stay focused and get the results you need.
Use the SMART rubric when creating your goals. That is to say, your goals should be:
.png?width=1320&name=How%20Recruiters%20Can%20Get%20More%20Out%20of%20Google%20Analytics%20visuals-01%20(1).png)
The second half of this is to pick one, or at most 2 metrics or KPIs that you want to measure. Remember, you’re just getting started so keeping it to a single measurement is the best way to get your feet wet without drowning in the data. Want to know where applicants for a recent opening came from? Great, there’s your metric, source of hire.
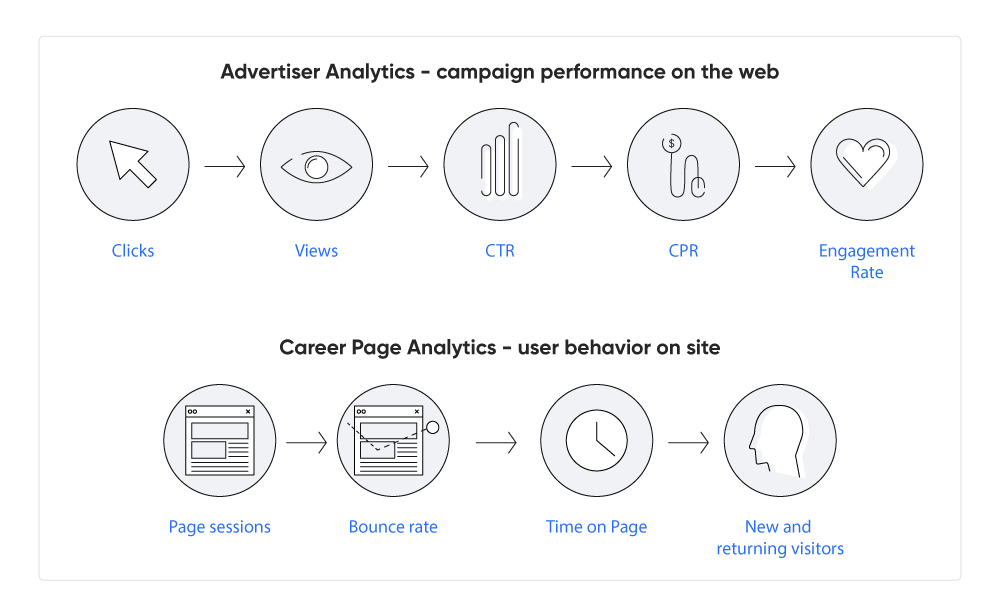
Google Analytics Fills in the Gaps where Native Analytics Stop
Sticking with our example of finding the source of applicants for a role, you may already know that 60% of your tweets generate click-throughs. But do you track where those visitors actually go on your site? All Twitter’s analytics page can tell you is that a person clicked on the link in that tweet, they can’t follow the audience member onto your site and track where they went after they left Twitter.
Enter Google Analytics. By copying a small piece of code onto your job description pages, you can find out where those inbound visitors actually came from. What’s more, you can track them as they jump around your site. And if they leave your site, but come back later, you’ll know that too. Maybe an applicant got to the description page from a landing page from a completely different campaign. How valuable is that information? Now you can go to the campaign manager and work out what went wrong that they attracted someone who jumped all the way to your opening instead of theirs.
Tracking the Entire Candidate Journey: One Click at a Time
That bit of code mentioned above? That’s called a “tag,” and it’s a snippet of Java code that sends tracking information to your analytics dashboard from any page you install it on. If you have access to the HTML of your job listing pages you can do this yourself, otherwise, you may have to work with your designers or developers to get the tags in place.
Once they’re set up, however, you’ll be able to track anonymous visitor data no matter which pages your visitors click on or between; you can track the user from the very first contact with your page all the way to the last one.
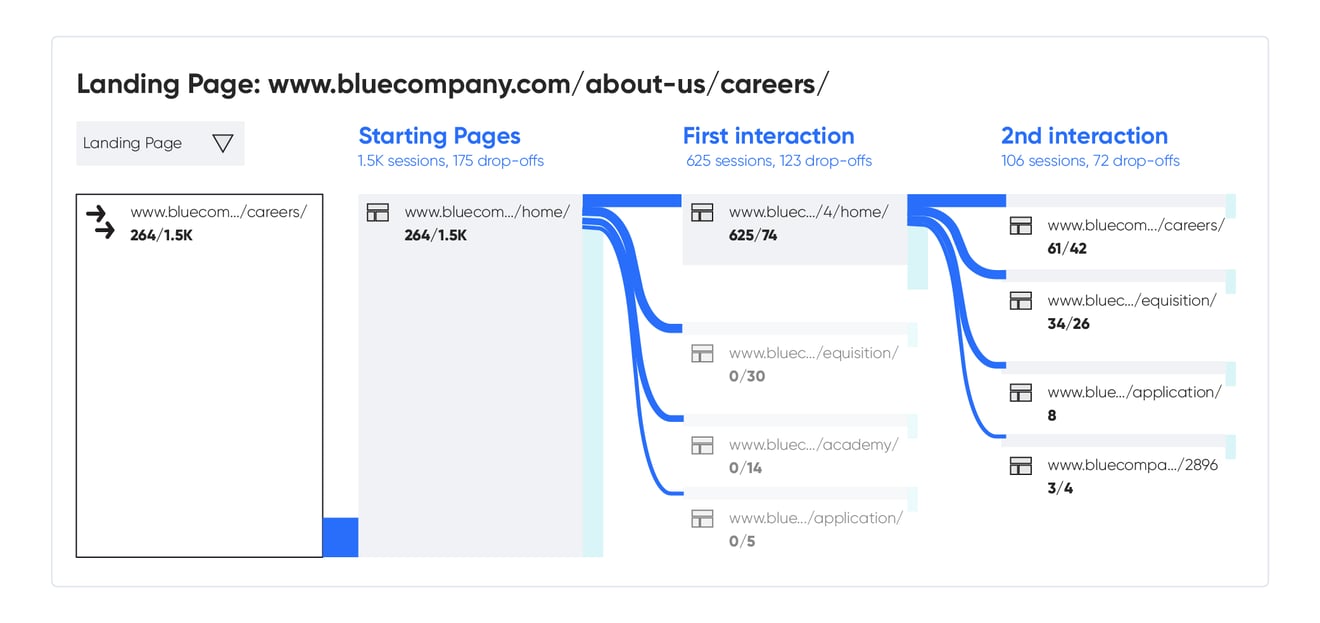
- That means you now have unprecedented access to the precise steps and stages your candidates take as they explore their journey across platforms and around your career portal.
- Are your active applicants coming from one main source, or are they evenly spread out across your campaign posts?
- What are the pages with the highest drop off rate? Is there a technical problem or is actually the page content that is making you lose all this potential candidates?
This is crucial information to have, as it lets you ensure you’re putting enough effort and resources behind the channels that are performing, and pulling those that aren’t.
Find Out Just How Entrenched Your EB is with your Audience
Since we’re already talking about source of hire as our sample metric, there’s another powerful piece of information you can glean from this metric—how well your EB is resonating with your audience. This ties directly in with the previous section, as it’s following a candidate’s journey back to the source that will tell you the most about how well your EB resonated with them. If an applicant started from a Linkedin or a Facebook post touting your EB, that’s a good indicator of a strong connection made.
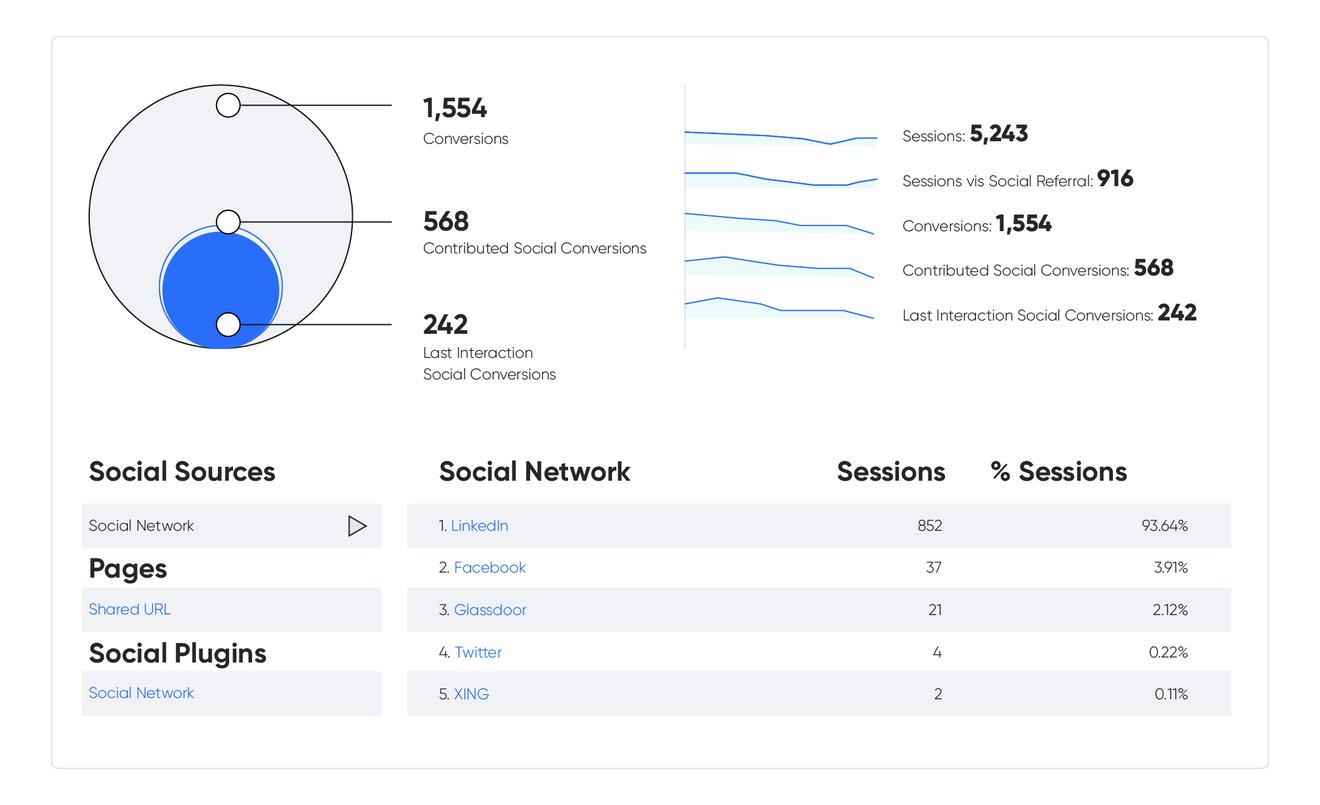
On the other hand, if they came to your application page directly from a job listing on Glassdoor or a similar job board, there’s less likely a connection with your EB and more likely a direct connection to an active job hunt on their part.
What does all this tell you?
- This data can be used to help you focus your budget and energy.
- Your Google Analytics dashboard is showing you that the majority of your active applicants are coming from EB campaigns, first of all, good on ya!
- Secondly, this tells you that you have a strong EB and to keep your focus there.
So what to do with all this information?
Use it to your advantage of course. Once you have your account set up and have one metric to track, you’ll start to gain a better understanding of the power of Google Analytics. Before long, you’ll have a second metric on your radar, then a third, and pretty soon you’ll be producing reports for management showing the overall success rates of each campaign and each specific job description page on your career portal where you installed that tag. Soon after that, you’ll find new metrics you’ll want to track and new ways to put the insights you gain to work for your current and future campaigns.